 J.D. Power released its Automotive Market Metrics report in September, which offered a glimpse into how the United States automotive retail and overall industry fared in August.
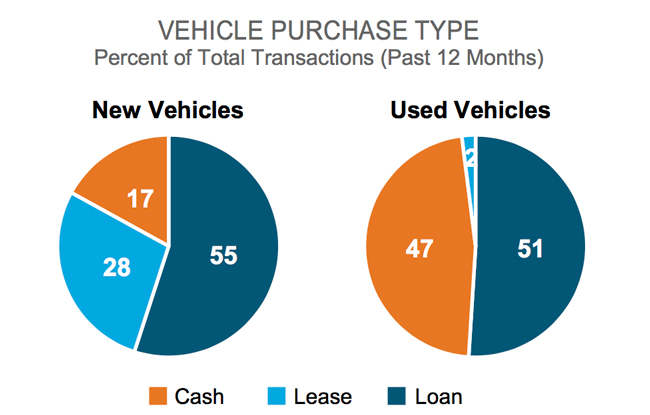
Based on the statistics provided, the percent of total transactions over the past 12 months for new vehicles can be divided into cash (17%), lease (28%) and loans (55%). For used vehicles, cash represents 47% of total transactions over the past 12 months, lease 2%, and loans 51%.
New lease monthly payments per average customer experienced an increase early in the year and has slowly and mostly decreased since, hovering in the middle range between $580-$620. For new loan monthly payments per average customer, that range is between $660-$700, and more so on the higher end.
On the percent of new vehicle loan terms for 84 months and more, August 2021 sits at 52%, slightly under the previous two months.
The days to turn for new vehicles rose in early 2021 and then slowly started to decrease over the last several months, reaching a level somewhat similar to September 2020—hovering between 65-70 days.
When comparing the new vehicle price versus the customer facing price, the former hovers between $44,000-$46,000, whereas the transaction price is between $40,000-$42,00—although more so on the lower end of that range for August 2021. The data was pulled from the JDPA PIN Incentive Spending Report (ISR).
When it comes to the percent of negative equity and trade-in, in terms of the percentage of negative equity vehicles at trade-in (new), negative equity sits between 20%-25% for the month of August, and trade-in is around 45%—similar to the previous months.